Recency, Frequency, and Monetary Analysis


Share

Recognizing behavior patterns allows you to identify the valuable customers whom you should tailor your services and shepherd dissatisfied customers back towards more regular engagement with your service.
Not all users stick around after their first few minutes with your app or use it daily. Not all users will spend money regularly on your app, but some might spend large amounts infrequently. The customer behaviors that you need to encourage to see the maximum profitability from your application will differ based on your business model.
Regardless of how your product is monetized, RFM analysis allows you to define and statistically measure what makes a valuable customer. Armed with that knowledge, you can monitor your user base and create measurements to ensure customers are retained based on their engagement or value.
What is RFM analysis?
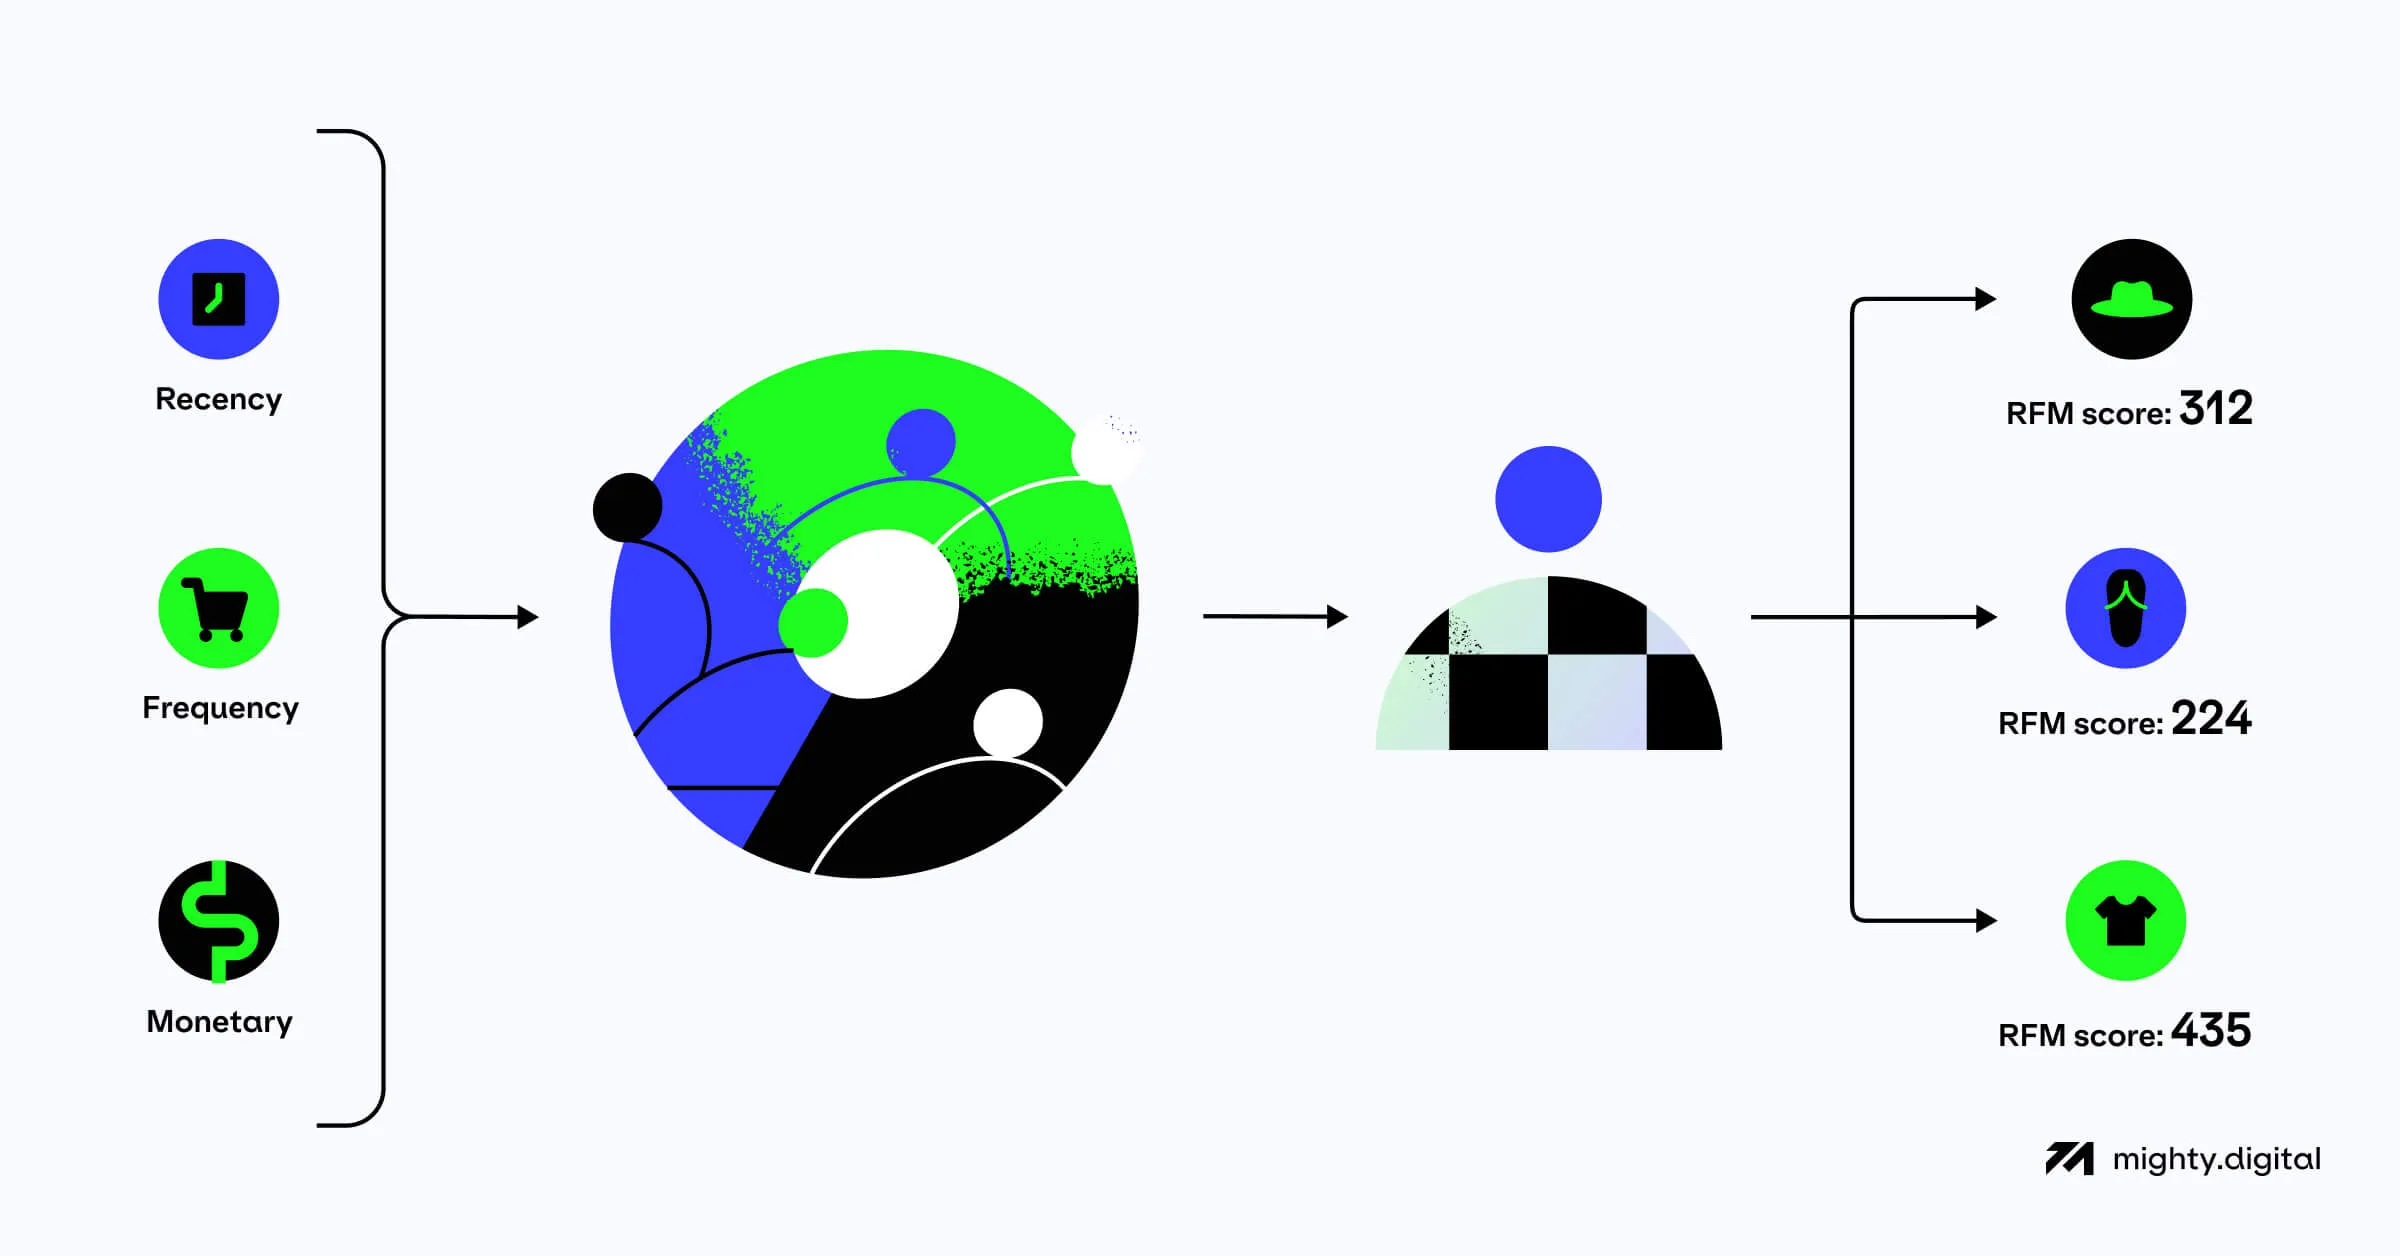
RFM analysis serves as a strategic method for customer segmentation and behavioral targeting, employed by businesses to categorize and group customers. This process aids in forecasting future user behavior and enhancing the efficiency of budget allocation. RFM looks at three metrics (the R, F, and M):
- Recency: How recently has the user spent money?
- Frequency: How often do they spend money?
- Monetary value: How much do they spend in each transaction?
Customers receive a numerical rating in these categories. This rating is usually between 1 and 5, where a higher score is better.
Each RFM metric, taken independently, provides a clear measure of user behavior.
Once you’ve defined an RFM model and started collecting data, you can statistically analyze each metric and create audience groups and segments to identify user behavior. Taken as a joint measurement, the RFM score gives a lot of information at a glance, allowing for quick identification and proper handling of different kinds of users.
The simplicity of the RFM system belies its usefulness. Being simple makes it more useful as it is easily understood by the analysts, decision-makers, and customer agents who will be referring to the score.
Benefits of RFM: statistics to tell you what makes your users tick
Scoring your users according to an appropriate RFM model lets you assess their current value. If you track these scores over time, you can make predictions about their behavior. It’s an easy, intuitive way of gaining insight into your user base.
Finding and keeping valuable users
Satisfied users will offer valuable insights into what makes your application appealing. You can identify users with a high-frequency score and communicate with them. Discover what continues to attract them to your app, and make sure to maintain and improve those features.
Similarly, you can find users with a high monetary value score and identify their spending patterns. By finding out why users spend, you can encourage those behaviors — finding new ways to increase the frequency score of users with a high monetary value score. High monetary value users are also good candidates for additional outreach and promotion to encourage continued use of your application.
Customers who have made recent purchases (i.e., those with high recency value) are more likely to remember and use the app again. Encouraging recent users to return can increase spending.
Users with a high score on every RFM metric are your golden goose. By paying attention to these users, you can zero in on what makes your application engaging and identify and reinforce the value you are providing to the user.
Retaining users
By tracking RFM scores over time, you will be able to spot users who are starting to use your app less, or starting to spend less money. Falling frequency scores will identify users on their way out and let you take measures that react to real-world, current information to stem the flow.
The recency metric is useful to preempt falls in the frequency and monetary value metrics. Users who usually have a healthy RFM score but haven’t been seen in a while can be enticed back with reminders, targeted offers or freebies.
RFM scores can be particularly useful when a customer reaches out for support. Support resources can prioritize high monetary value users who may be disengaging while de-prioritizing low-value users who rarely interact with the application. Support agents can identify what kind of user they are dealing with by a glance at either their RFM score or segment without having to perform a detailed check on that user’s history.
…and getting back the ones who have left
There are always ways to engage a customer. By grouping users who have left at different stages in your application’s lifetime, you can identify potential causes of why they left and attempt to reach them with a resolution — for example, by re-adding an application feature that was removed in a prior update but turned out to be more popular than you thought.
How to build an RFM model
RFM analysis requires an RFM data model. The RFM model defines a scoring scale and how scores are ranked.
Deciding on the scale and scoring system
The first step in building an RFM model is deciding on a scale. RFM models can be customized depending on your organization and business expectations, making this analysis highly adaptable. However, in most RFM models, each client is given a score from 1 to 5 for each RFM component, where 1 is the lowest score, and 5 is the highest score. To define a score, all users are divided into five equal parts depending on the metric we explore: the first quintile contains the bottom fifth of the customer list (i.e., the 20 % of all customers), the second quintile represents the second fifth (from 20 % to 40 %). Similarly, if a customer scores 5, they are in the top 20% of all customers in this category. Note: this is not an absolute value but a relative value (compared to all other customers). We then combine these scores (not the sum) to get a three-digit RFM score.
RFM scores range from 111 to 555. An important conclusion from this position is that there are no terrible RFM scores. Even the best-ranking customers would not welcome excessive outreach, and lower-ranking customers might show great results with the right ways of nurturing and additional marketing efforts. So any RFM score should inform whether and what communications should be sent to that client.
RFM example in practice
Let’s look at a retail example to see how RFM scores work in practice. Jack and Will are two clothing store customers. Below are their general RFM estimates:
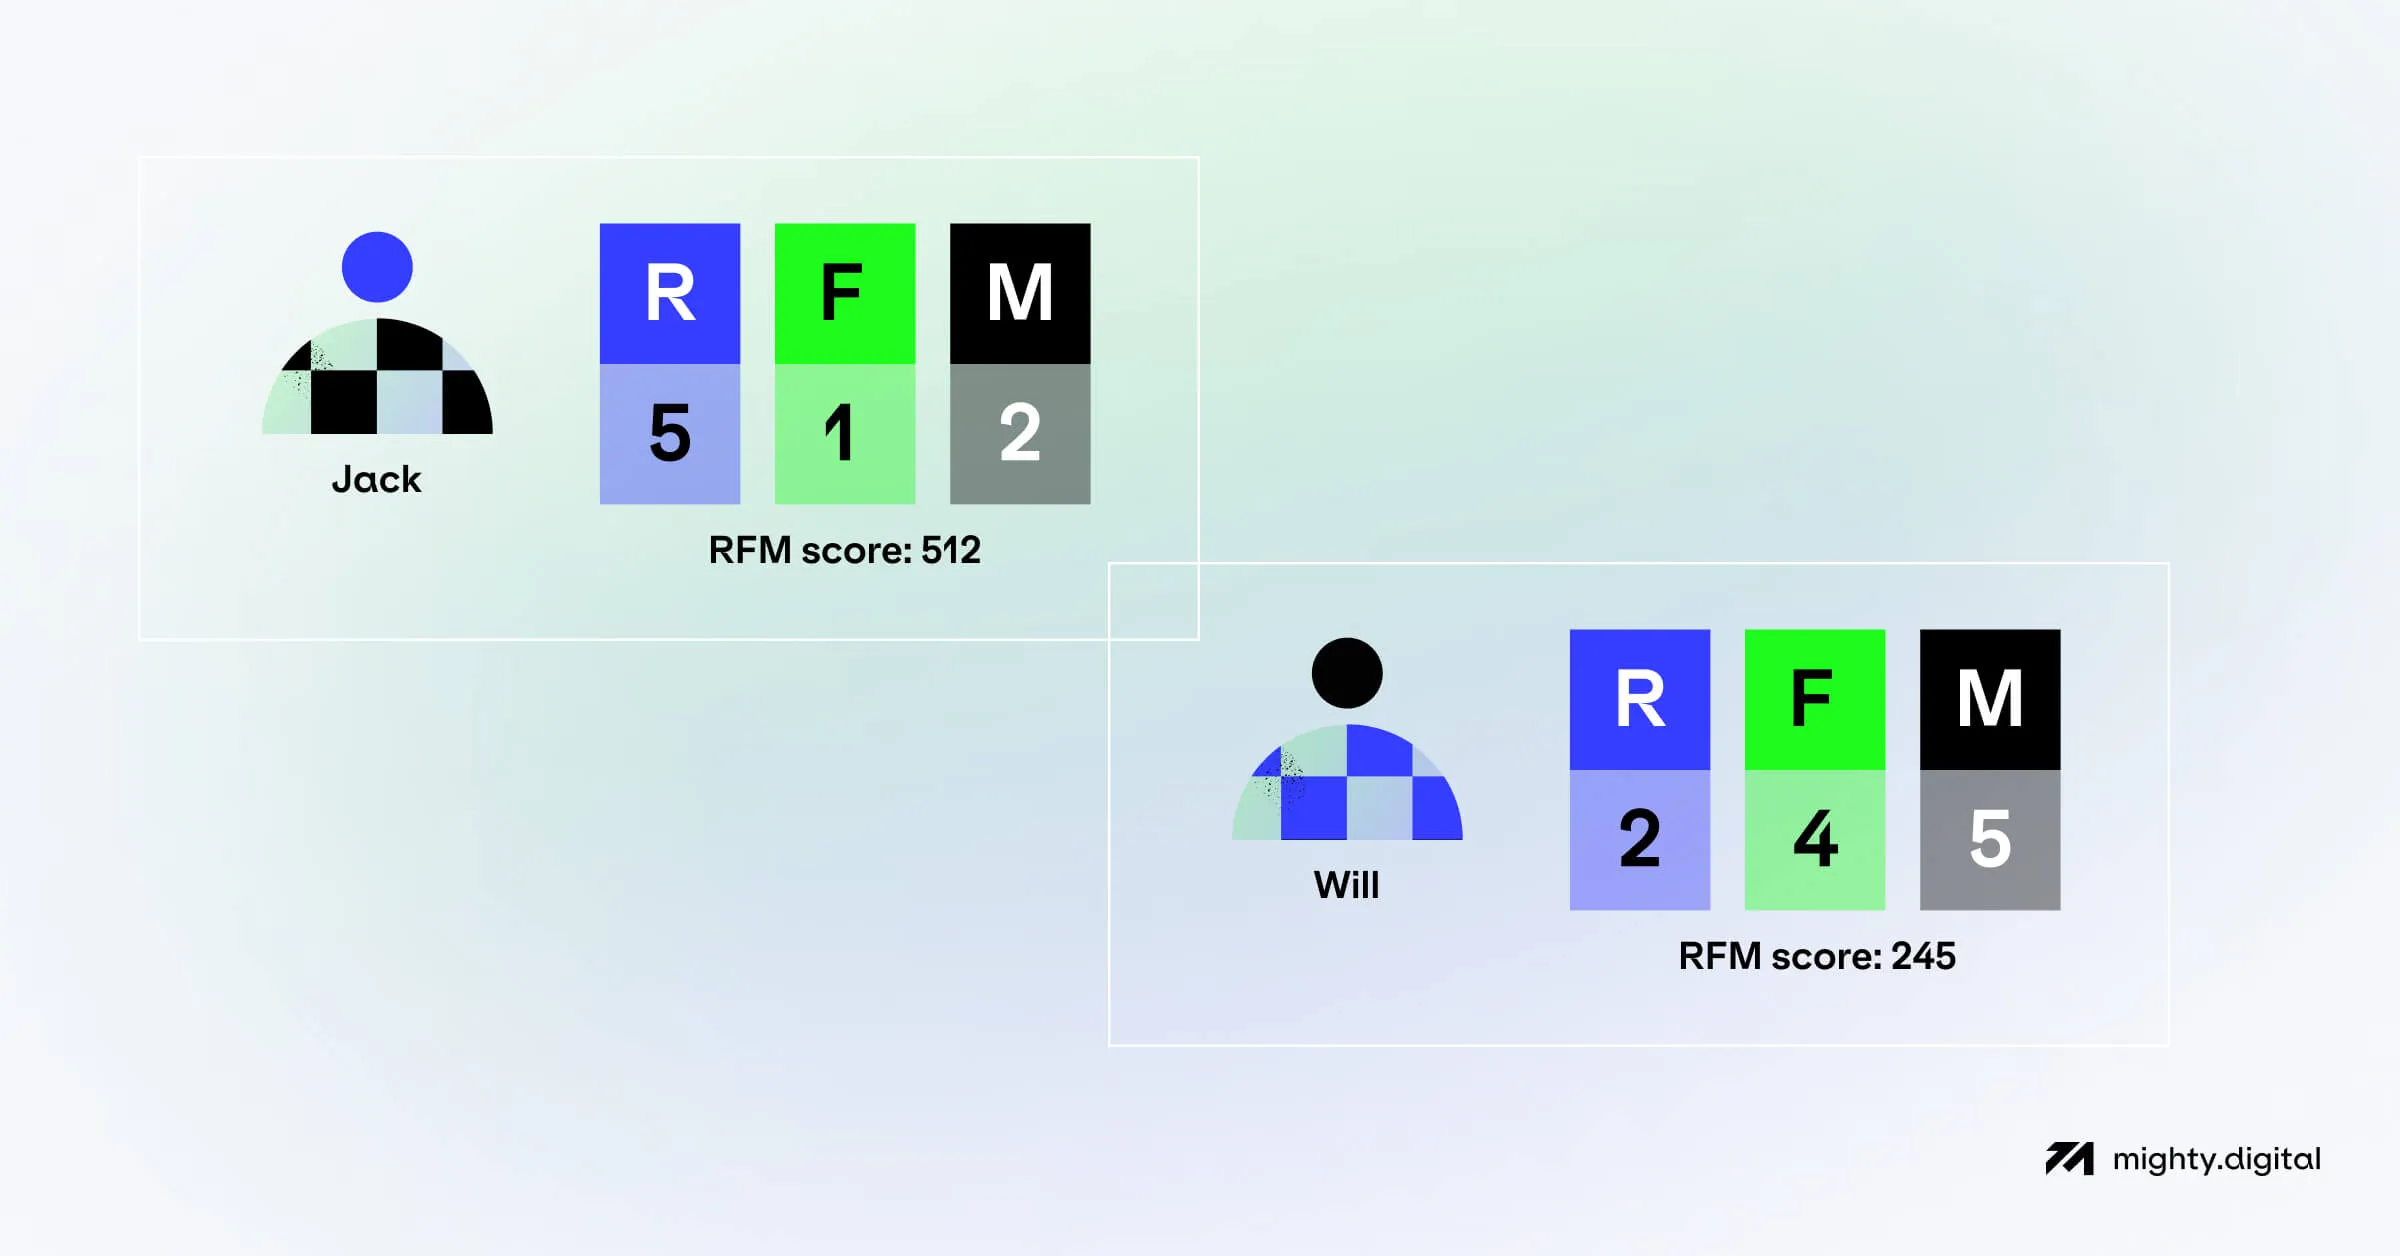
As we see in this example, Jack has a high recency score but a low frequency and monetary score. Likely, he’s just made his first in-store purchase, so they’ll want to take him on an elaborate welcome journey so they can make sure he gets the most out of his investment, that he has all his questions answered, and that he learns a little more about the store in the process.
Will, on the other hand, has a high frequency and monetary score but a low recency score. He often spent money in the store and made purchases, but it has been a long time since he made a purchase. They may want to research his purchase history and any other known information about him to send him a relevant and valuable offer for a repeat engagement.
If you offer multiple products, the customer may have an overall RFM score as well as multiple RFM scores for individual products or categories. For example, Emma purchased hats, sneakers, and clothing from the site, so her individual product scores are:
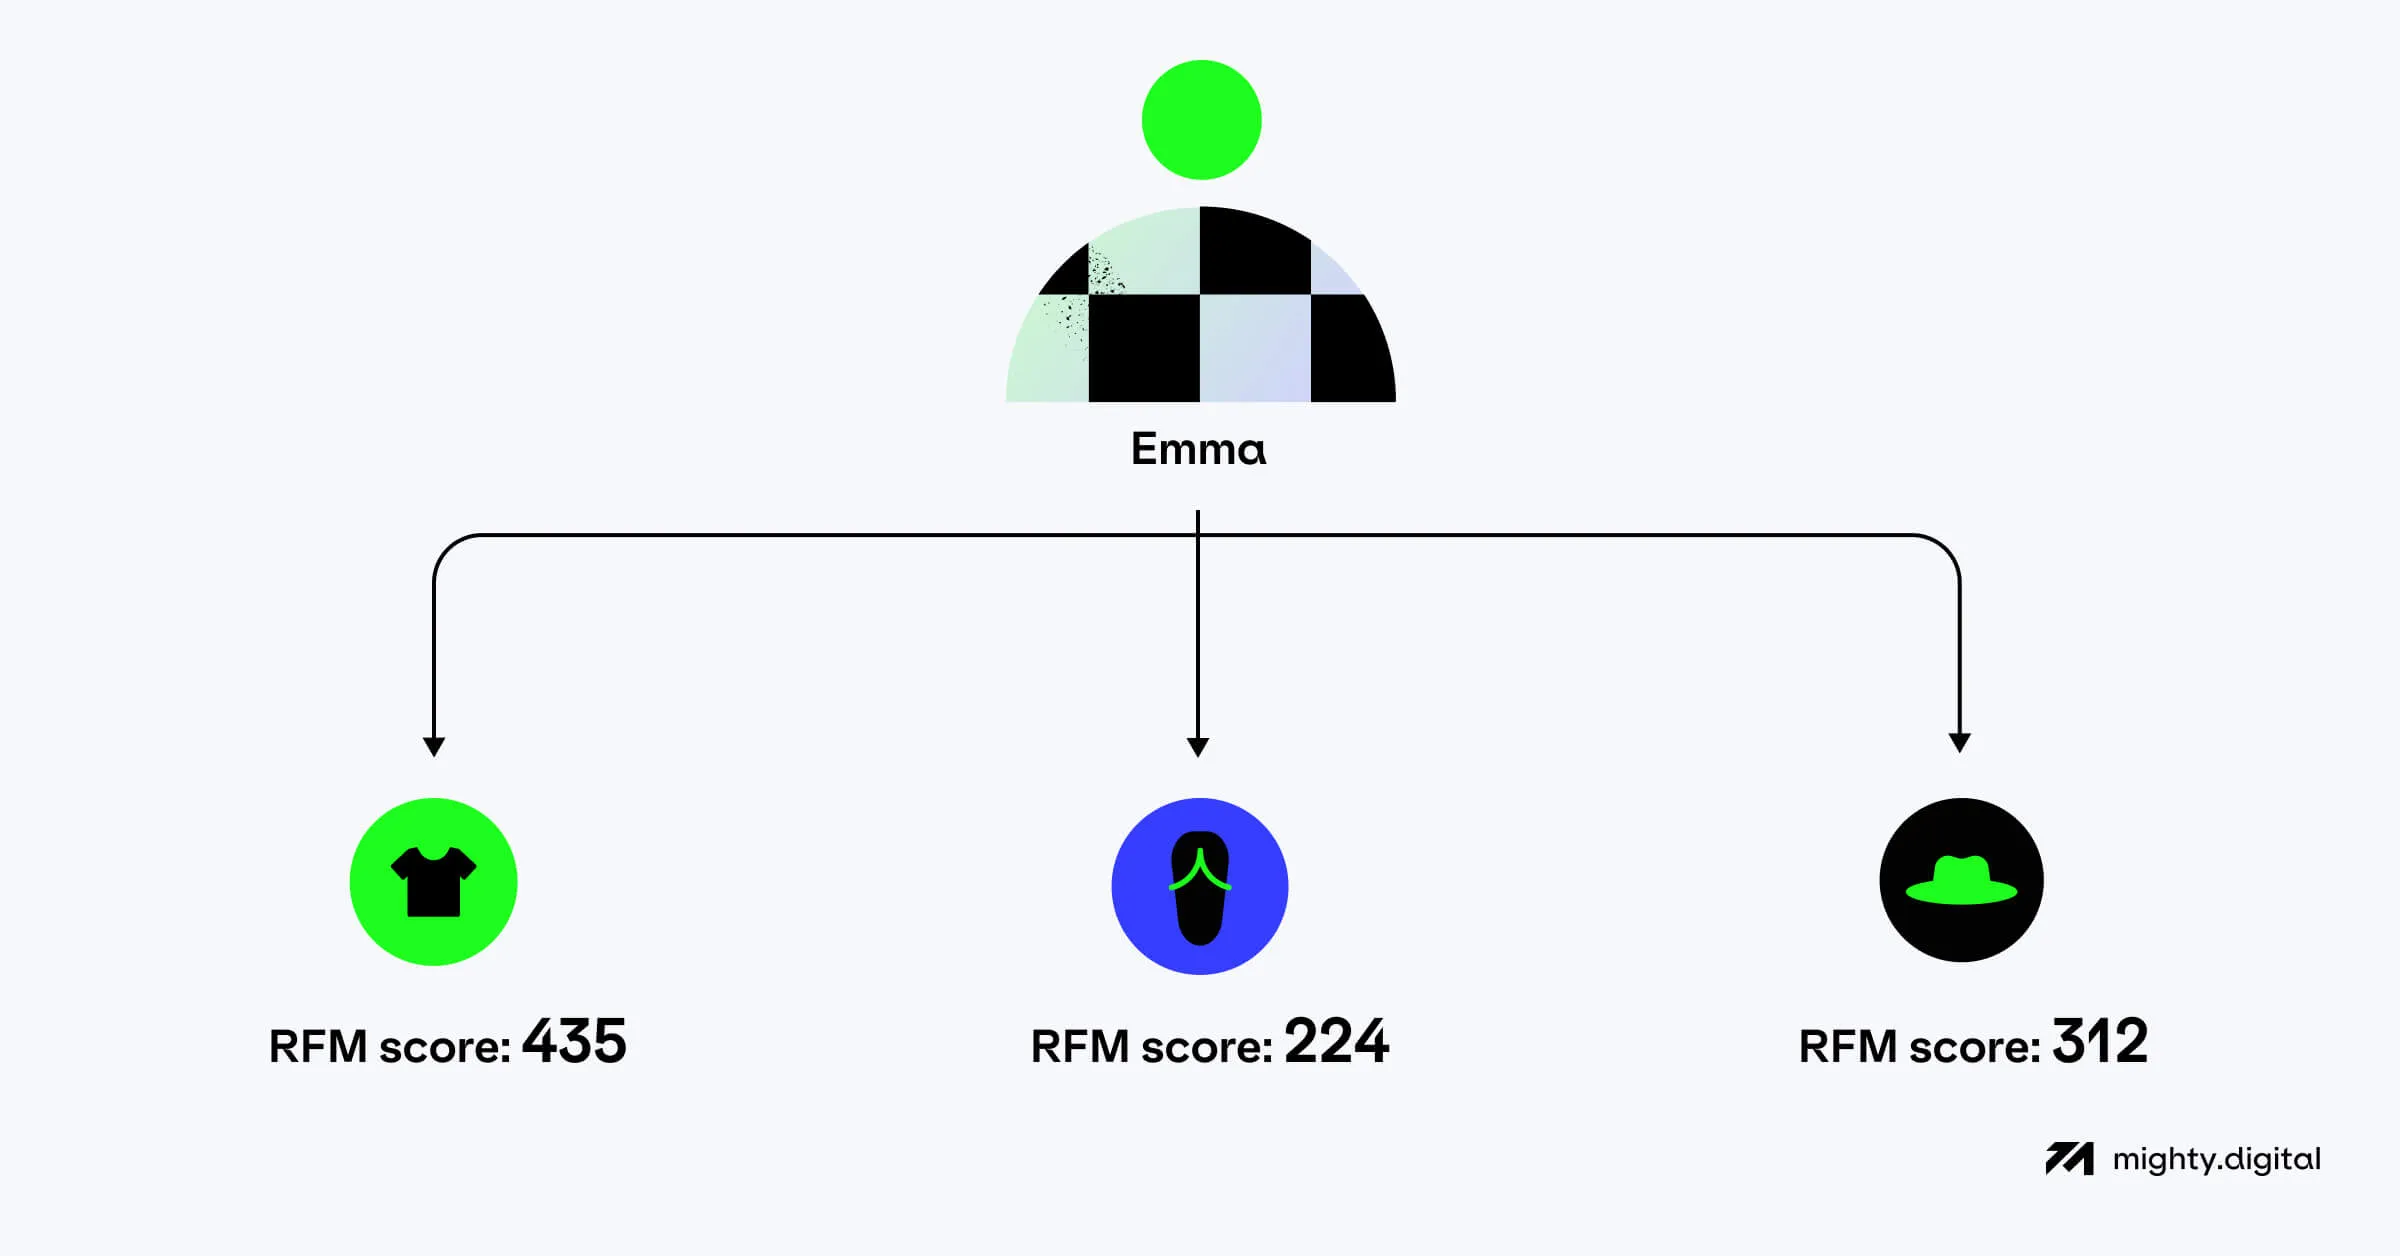
Product/category metrics allow your team to not only know how often a customer buys from you and how valuable they are but also to see any patterns related to the types of products they buy. This gives your team valuable insights that can help them create personalized messages.
For example, if we identify a lagging customer, we might want to engage them in a Win-back campaign. Using the product’s RFM score, we can quickly determine if that customer is interested in sunglasses or if we should send them a discount offer on clothing.
Testing your model
Your RFM models can be validated by applying them to historical data (from your data lake or data warehouse) and comparing them with the real-world interactions that followed. For example, you could apply your model to data from the previous month, and see how well the results line up with actual sales invoices from that period.
You are not limited to a single RFM model. If your audience is geographically spread out and using different currencies, you may choose to use an adjusted model for each region to account for exchange rates, local price expectations, and local spending patterns. A user with a high monetary value score in one region may spend less than a user with the same score in another — RFM analysis allows for these kinds of variations.
RFM score analysis — grouping and segmenting your audience
Once you’ve set up your RFM model and assigned RFM scores to customers, your team can use those RFM scores to segment customers into customer segments. This allows a powerful framework to identify customer segments and make informed decisions about how to improve the customer experience.
Here are some standard customer segments:
- Fresh leads – RFM score = 511
- New and promising customers – RFM Score = 514
- Loyal customers – RFM score = 453 (the frequency is what makes them loyal)
- At-risk customers – RFM score = 324
- Cannot lose – RFM score = 155, 245
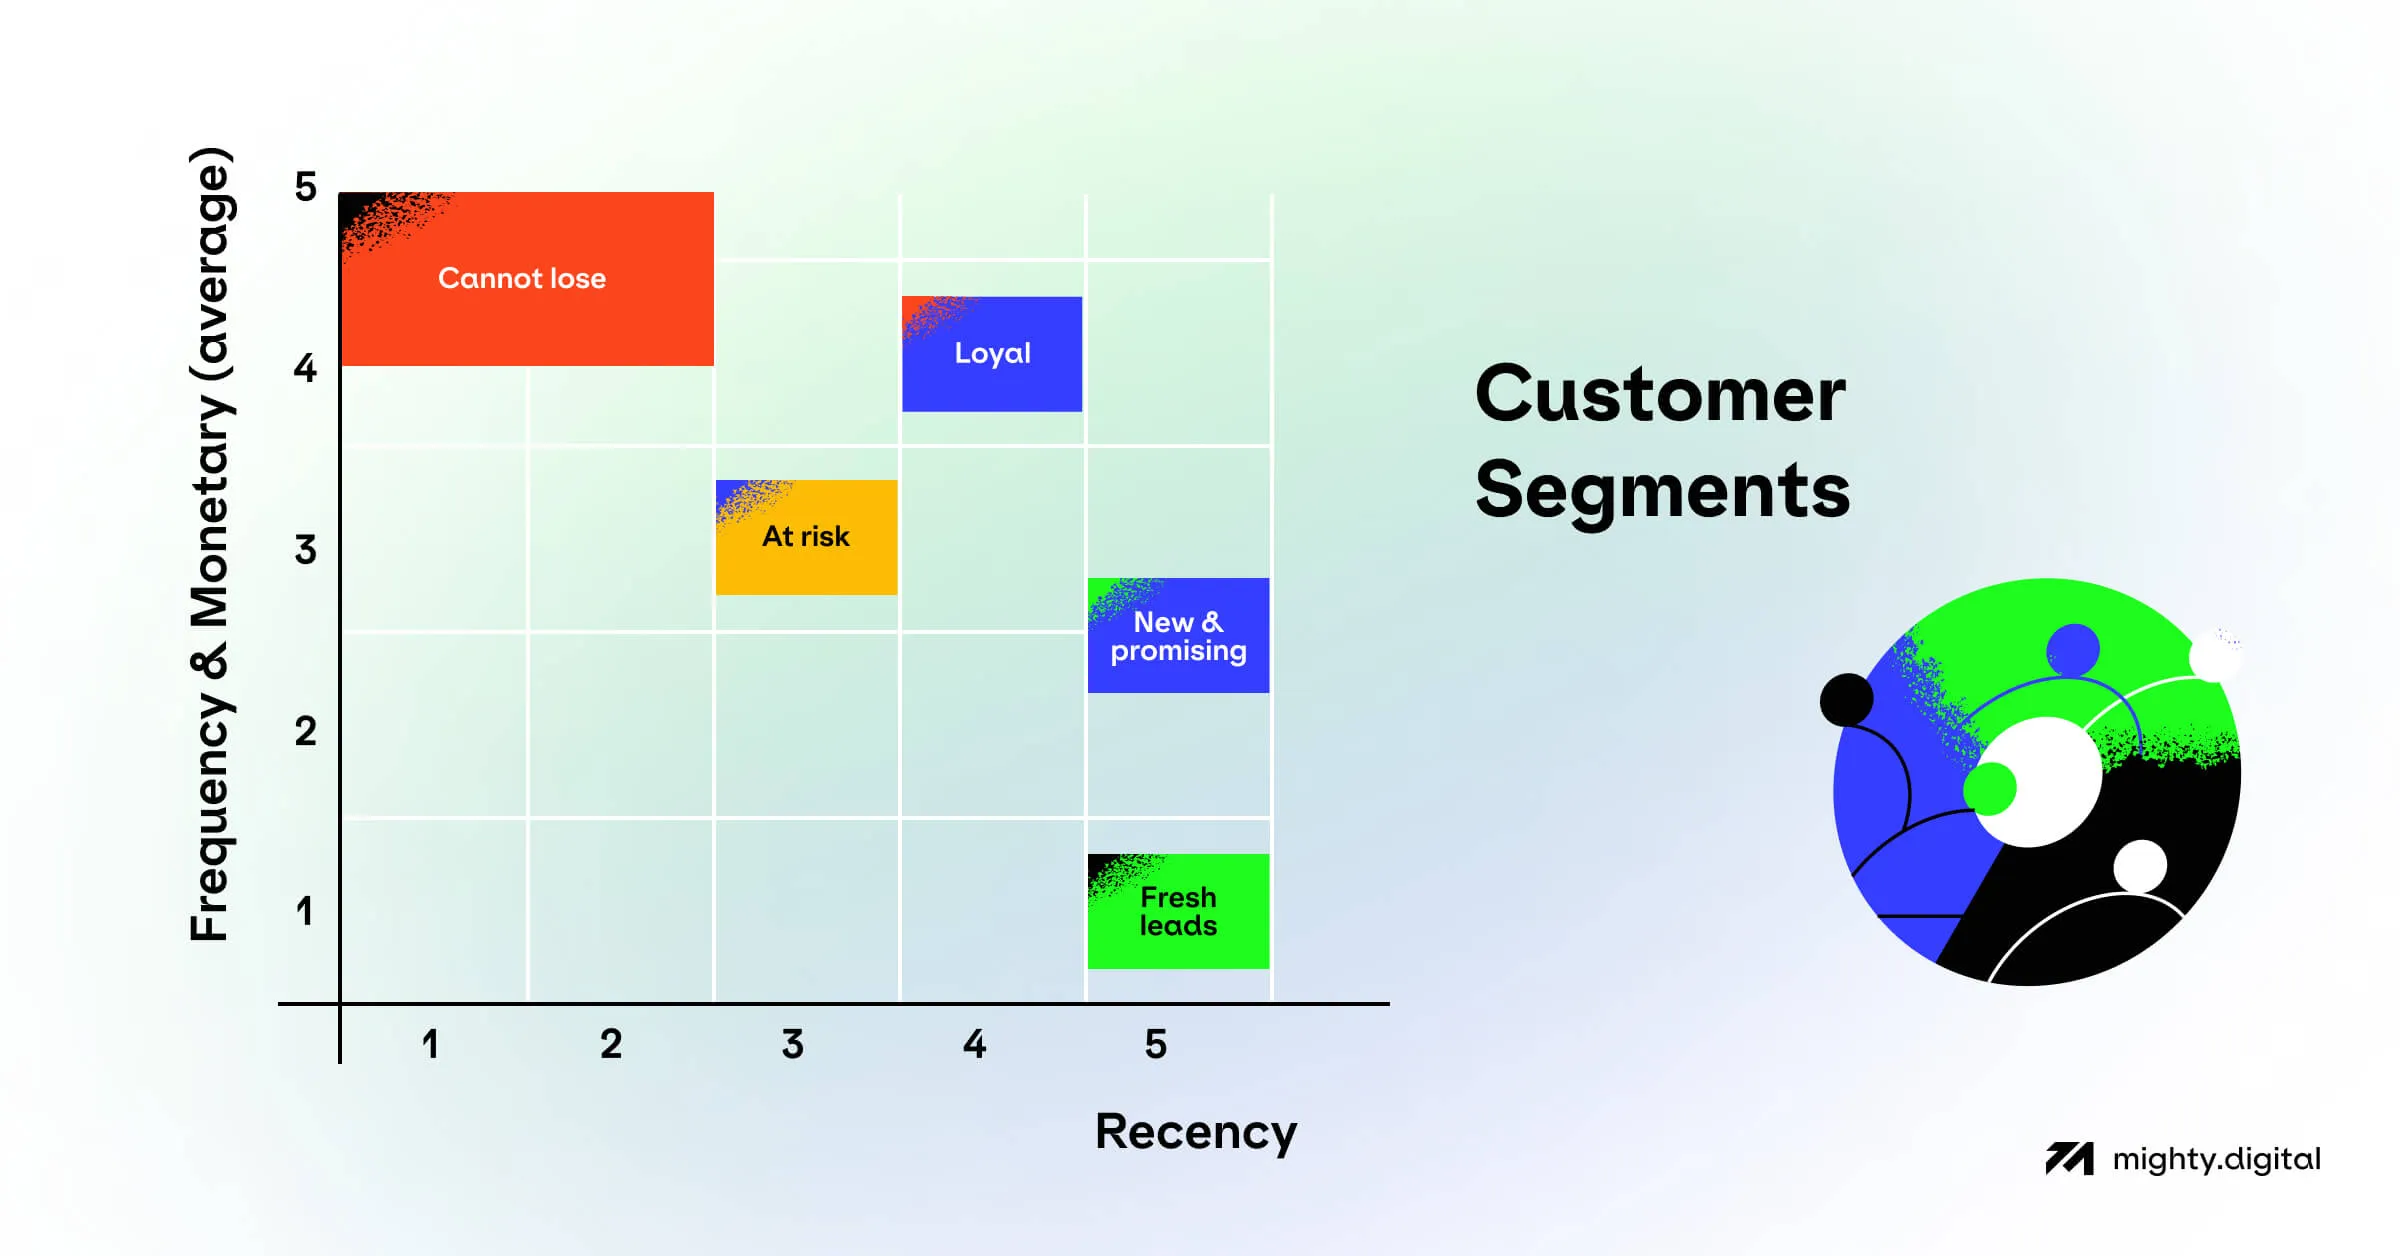
Once the value of each segment has been assessed, groups can be defined for quick identification and action based on their current and historical RFM metrics or segments. Some groups might be created using only one metric, while others may combine more segments. Groups can also be built on the changes in RFM scores over time to track audience movement. Once customers are segmented, you can use those segments to amplify your email or other marketing channel marketing campaigns.
Taking action
At Mighty Digital, we use the reverse ETL tool Hightouch to upload our segmented groups into our analytics and engagement tools (in our case, Amplitude and Braze) for further processing.
We use Amplitude to analyze the users within different segments, allowing us to isolate the funnels and charts that represent those parts of our audience and specifically include or exclude them. Braze is used to target specific segments with dedicated engagement campaigns, allowing us to focus on high-risk customers and offer them discounts and encouragement to remain engaged with our client’s products and prevent churn.
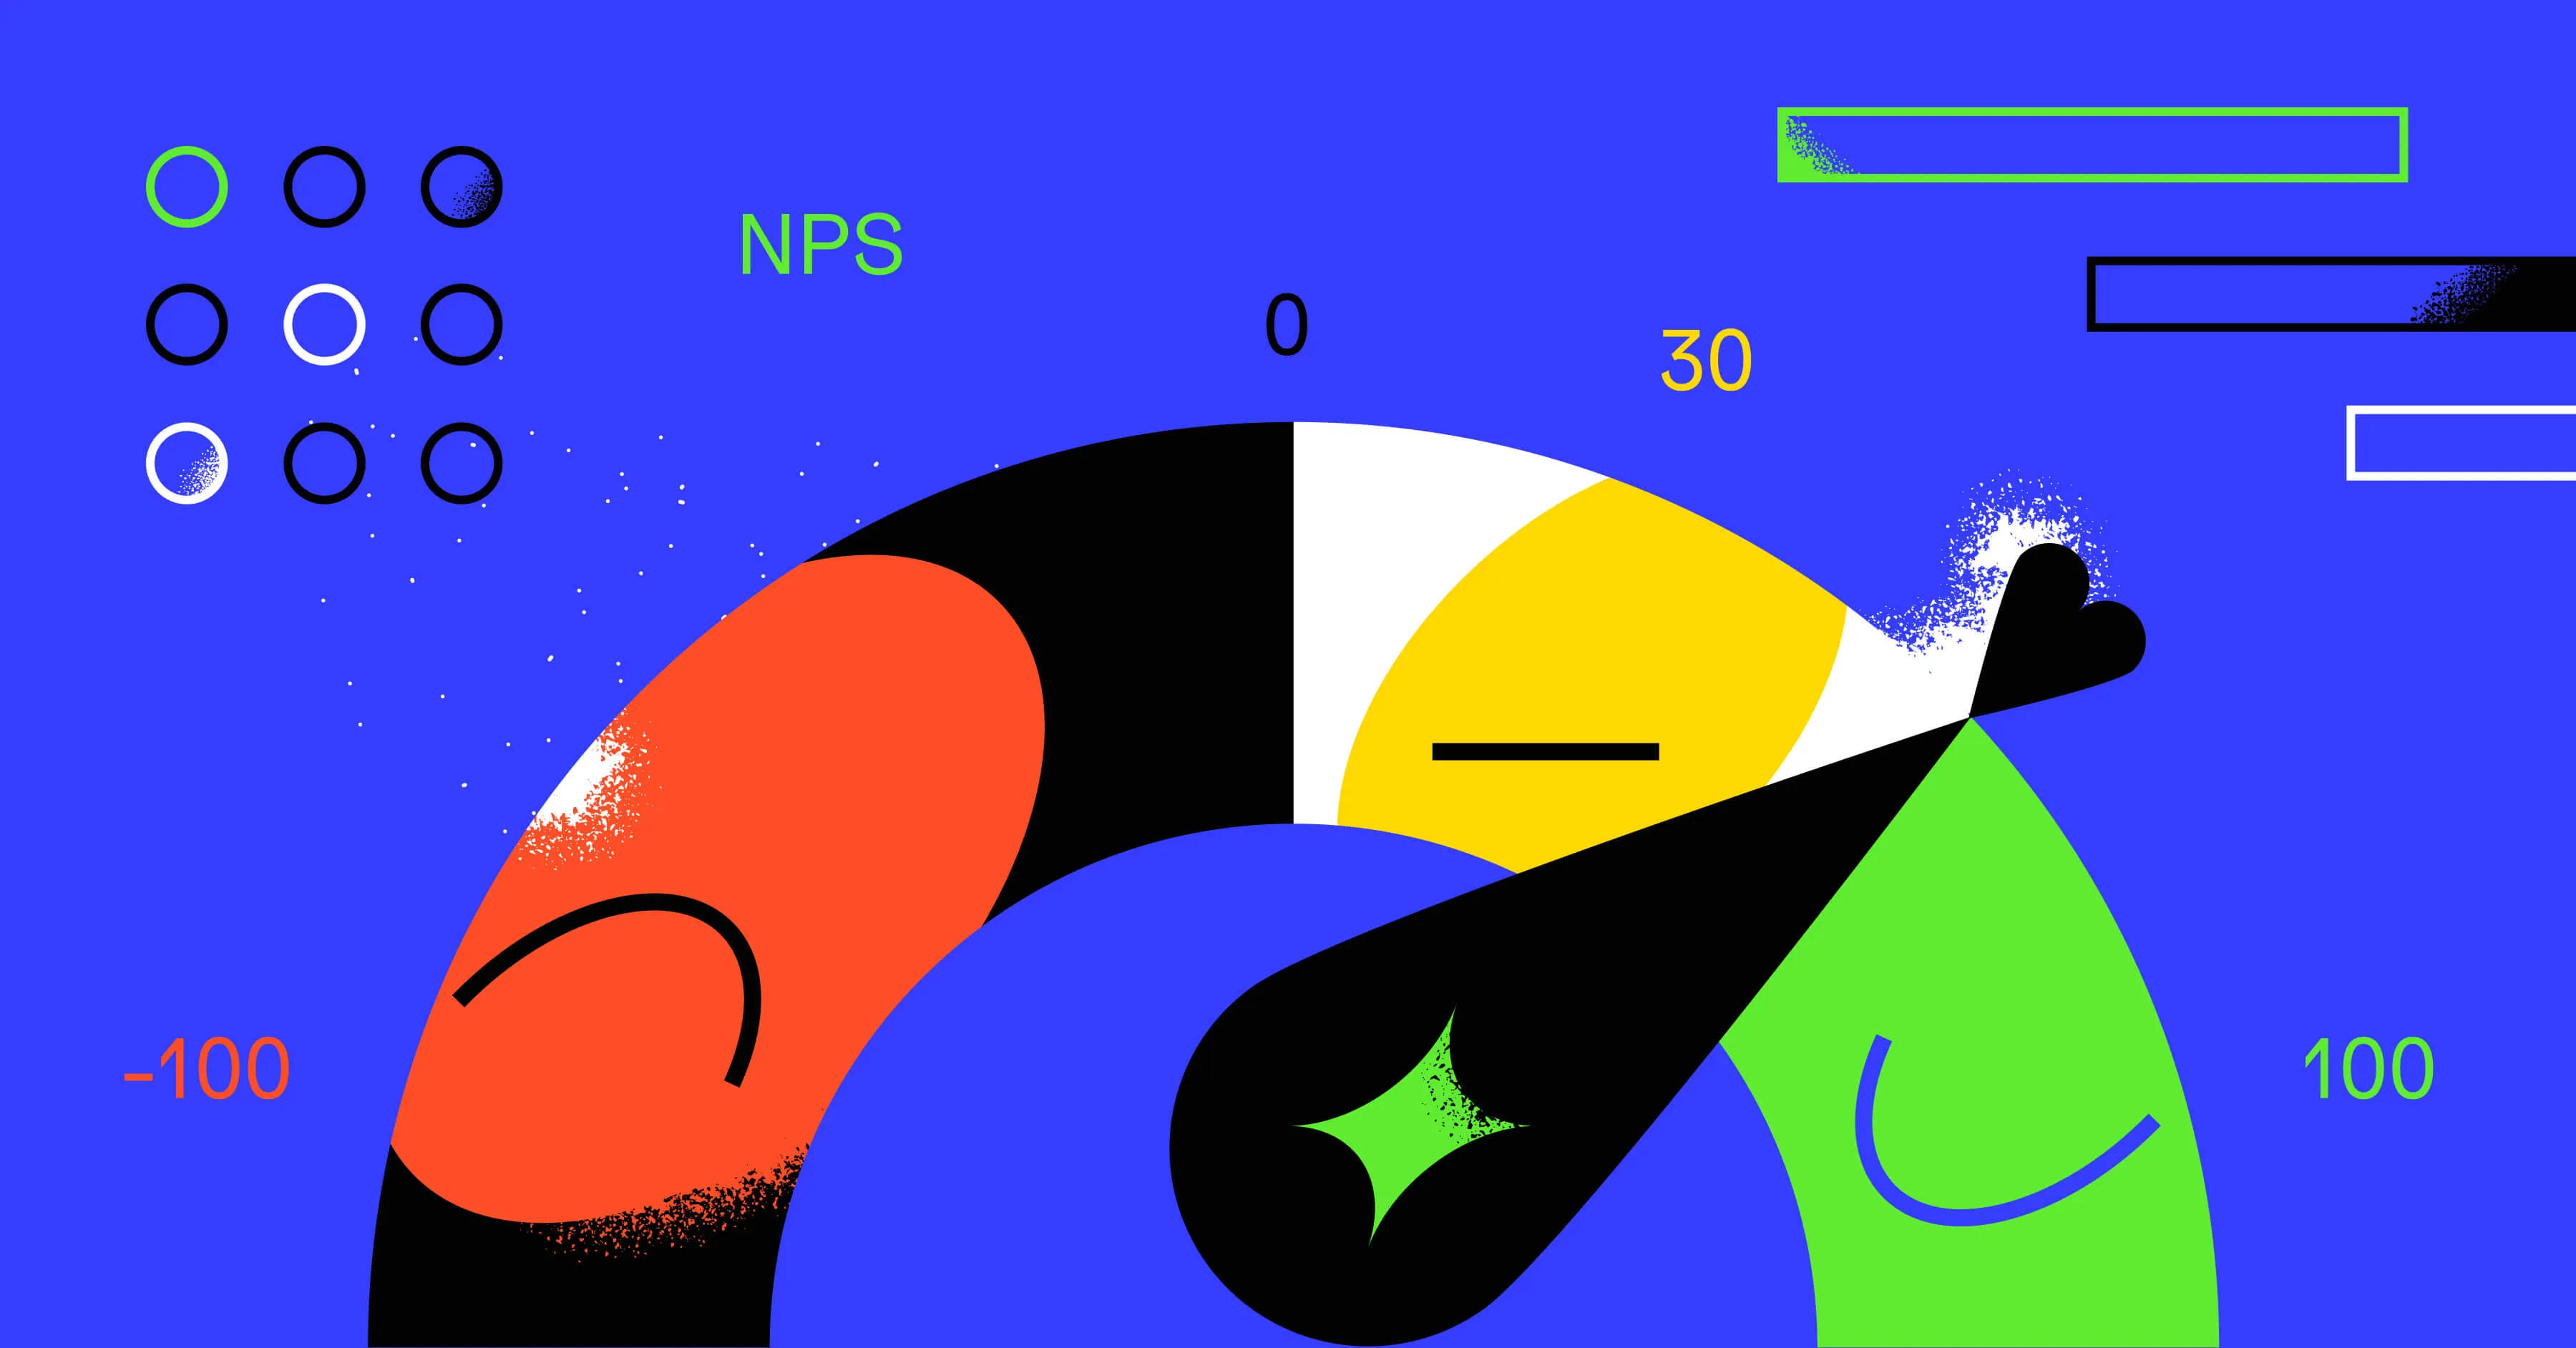
These RFM-based approaches mesh incredibly well with customer retention and growth techniques that use the Net Promoter Score.
One size doesn’t fit all
RFM modeling and analysis are highly effective for both subscription- and product-based business models — but you must be aware that they are highly subjective. The user actions that would make your application both profitable and sustainable will be different from those for other apps. You cannot just copy the RFM models in use elsewhere; you must consider the landscape of your own market and your business requirements when building your model.
Once you’ve decided on a model, started scoring your users, built some user segments, and begun working on applying the insights being generated, you’ll probably find that they aren’t quite right — and that’s OK! Good data modeling is an iterative process — it rarely works on the first try. Your models should adapt to changing market conditions, your expectations, and those of your users.
Limitations of RFM analysis
While RFM segmentation is a potent tool, it is not without its boundaries.
This model doesn’t work well for services, tools, or products that customers buy only once in a while. The lack of frequent purchases makes it hard to gather accurate data.
RFM analysis is also based on just a few behavioral traits, providing insights into customer purchasing behavior, but it doesn’t explain why each customer made a purchase. RFM is a very broad statistical analysis method, so you may need to further segment your user base if you find that users are falling into groups that don’t reflect their real-world situation. Leveraging the power of CDP, marketers can merge RFM scores with additional behavioral and demographic attributes. Enriching your RFM method with available data like geolocation, app activity, or recently bought products will result in segmentation of much higher potency.
Some marketers tend to use the results of RFM segmentation in order to concentrate their efforts solely on the top-tier users and overlook lower-ranked customers, even though many of them could hold potential value. Remembering that RFM is a great tool to streamline marketing strategy for different customer segments and optimize budget distribution is vital.
RFM variants
The RFM model can be adapted to account for different scenarios where the value users provide is not through direct monetary payment. Here are some common RFM model variants:
- RFD (recency, frequency, duration): the duration the user is paying attention to your product replaces their monetary value. This is relevant to products that are monetized through sponsored content viewed by a readership, viewership, or player base.
- RFE (recency, frequency, engagement): in this case, the engagement replaces the monetary value. Engagement is a loosely-defined term that will depend on the kind of service you are offering. It could refer to the number of friends a user has on a social network or the score they achieve in a game.
There are no hard and fast rules. Adjust your models, scores, and segments if they don’t work or are outdated. Data analysis must evolve with the data!
Expert RFM modeling and analysis from Mighty Digital
Here at Mighty Digital, we like to consider ourselves scholars of statistics. Some might instead call us data dorks or number nerds. Whichever it is, it means we are always on the lookout for new ways to analyze data and apply the results for the best business outcomes.
RFM analysis is one of the many tools we’ve been using to help businesses get the most out of their data and continue growing beyond their expectations — even in harsh economic climates.
If you want to implement your own RFM analysis, contact us, and we’ll help you build models that reflect the real-world situation for your user base. We’ll work with you to make up-to-the-minute analysis available to you to help you keep your user base fresh, engaged, and growing.